CASE STUDYMaglo
Maglo
Finance
Realtime portfolio intelligence for busy operators
12+
dashboards built
1.1s
load time
15 min
refresh cadence
maglo-finance.vercel.app
what i built
A full finance dashboard,
from spec to production
from spec to production
01
Data visualization
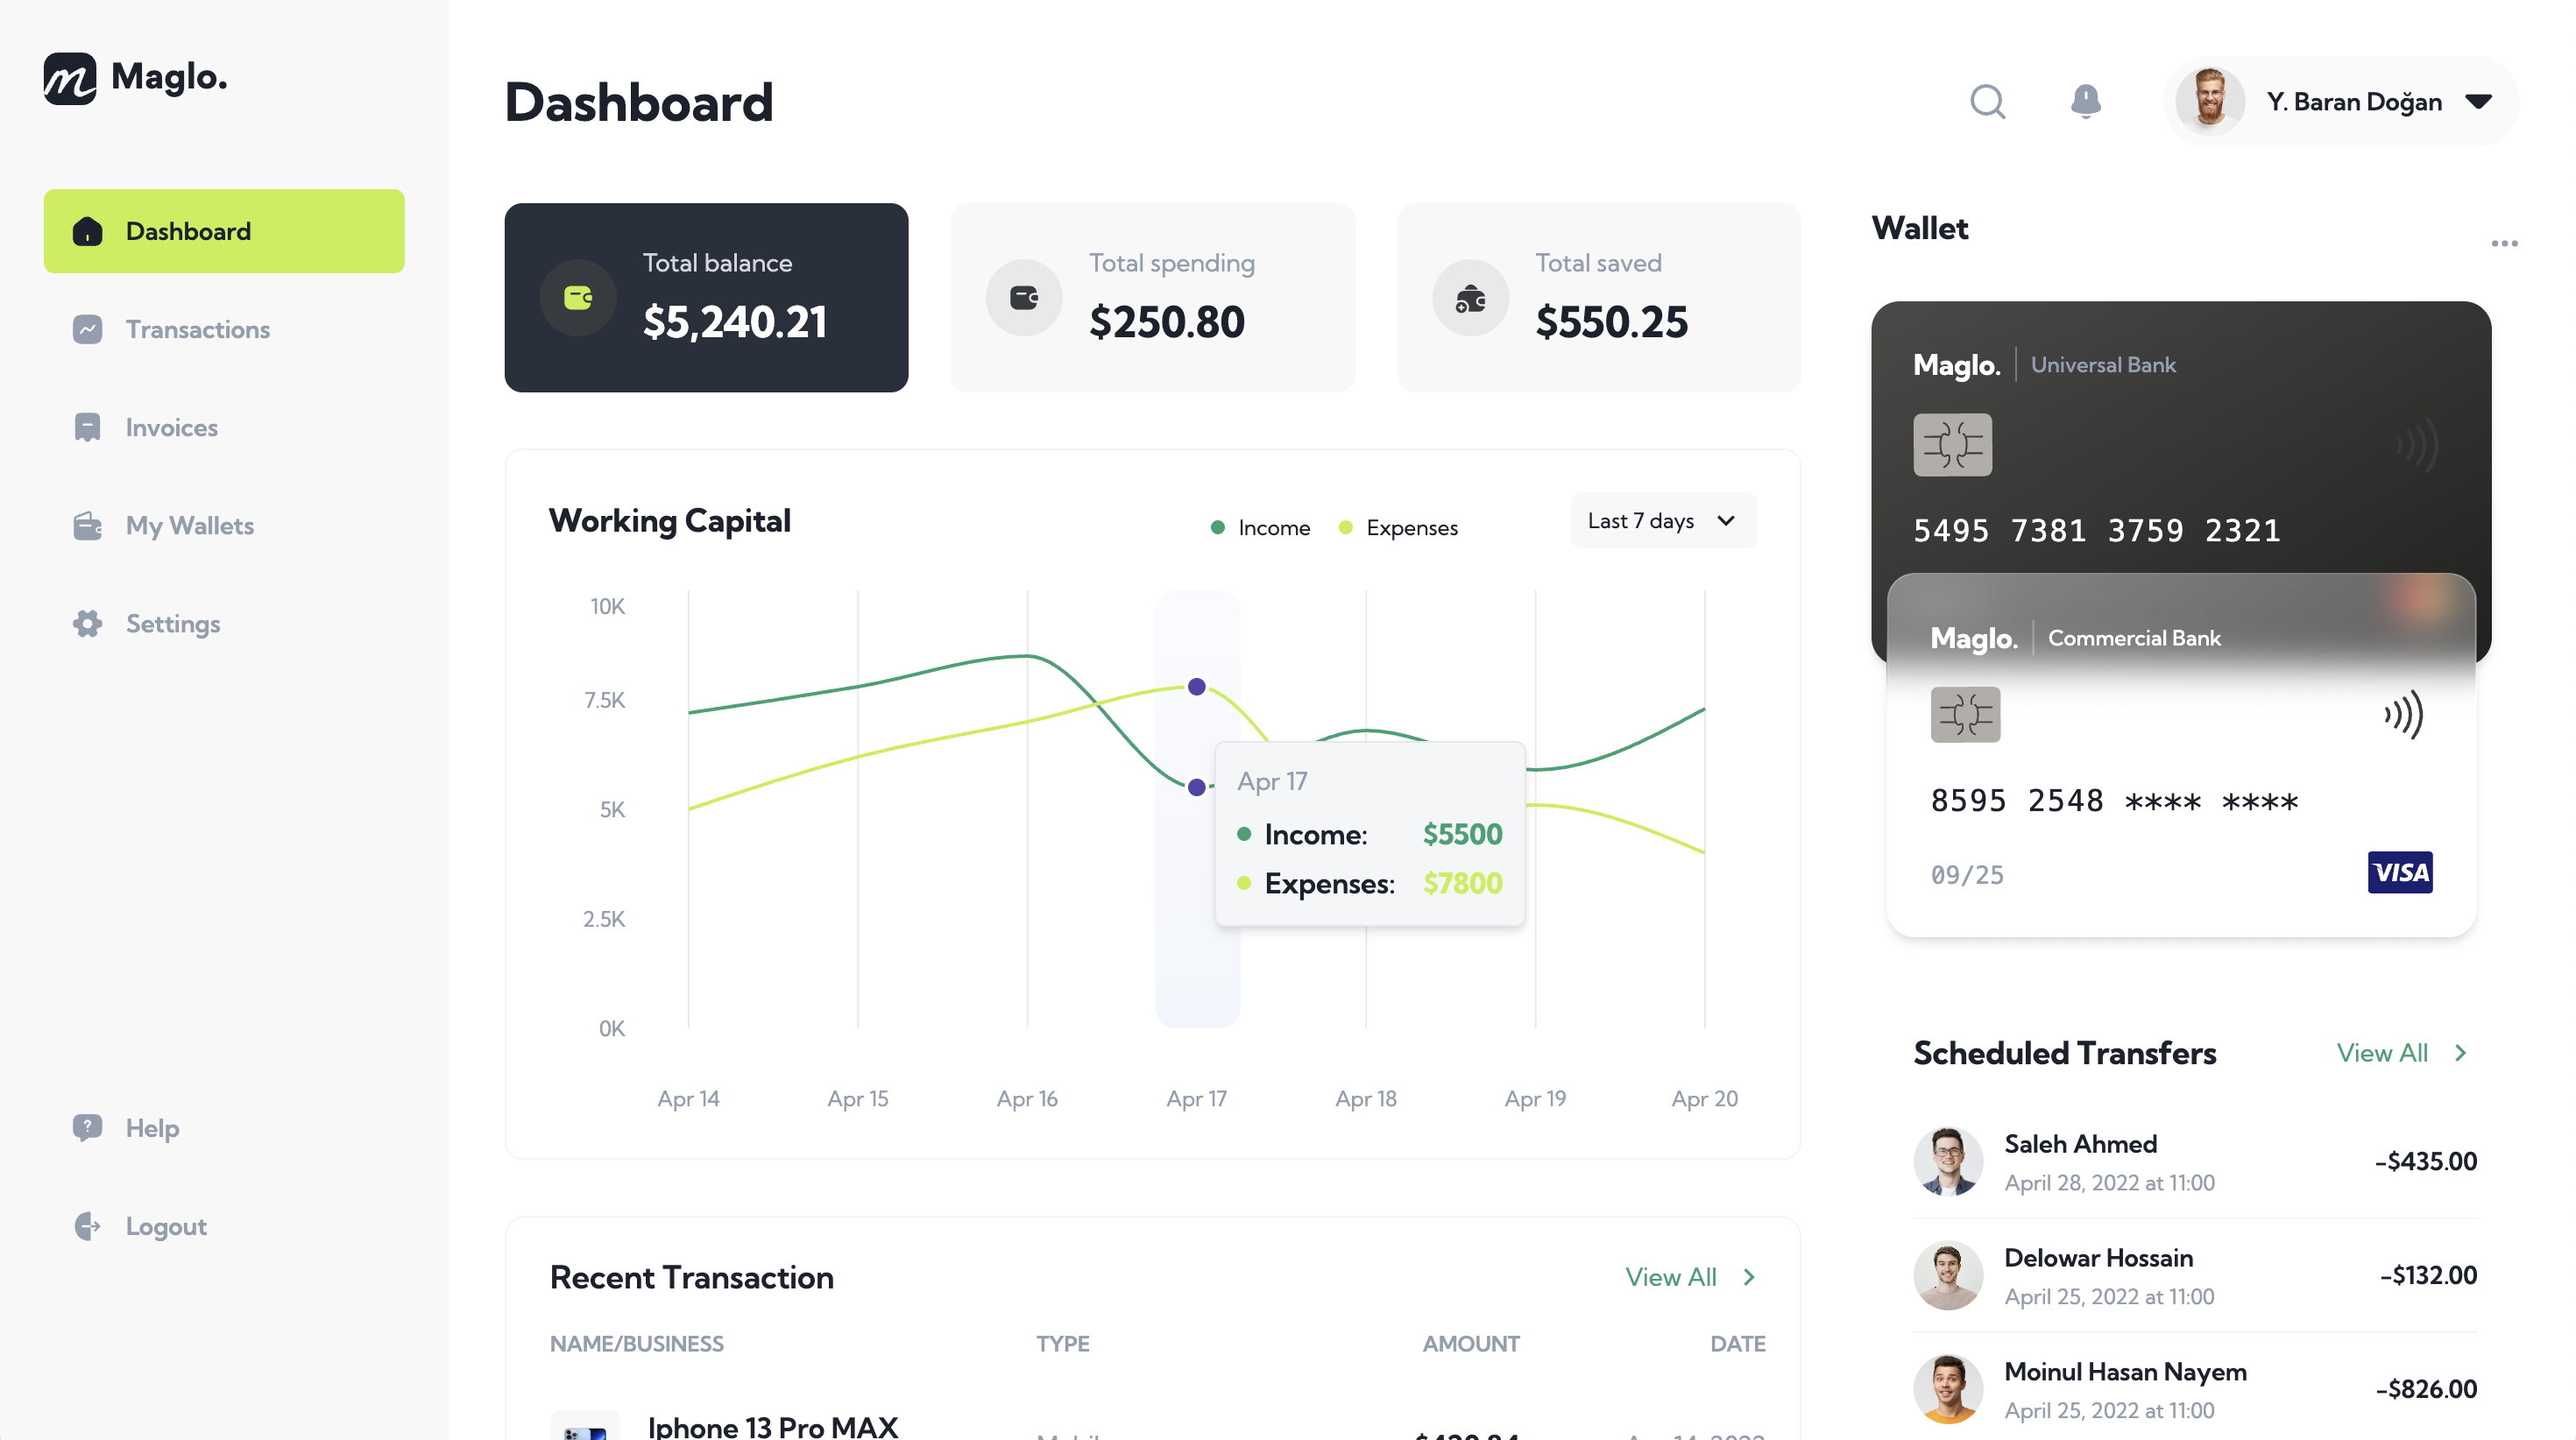
Multiple chart types — line, bar, donut, area — using React Charts. Each one matches the design spec spacing and color palette exactly.
02
State management
Zustand for global state — portfolio totals, filters, and time-range selection all update the charts in real time without prop drilling.
03
Responsive layout
Dashboard grid adapts from wide desktop layouts to mobile — charts reflow, sidebar collapses, tables become scrollable.
the challenge
Pixel-perfect means
no approximations
no approximations
The problem
Most implementations drift from the spec
- Finance teams were still sharing CSV exports and static slides, making it impossible to keep up with intraday volatility or see burn across business units in one place.
My approach
Design tokens extracted, then enforced
- Maglo Finance centralizes KPIs, holdings, and alerting inside a responsive dashboard powered by live charting, role-based access, and glanceable cards.
Built with
ReactTypeScriptTailwind CSSReact ChartsViteZustandGitGitHubVercel